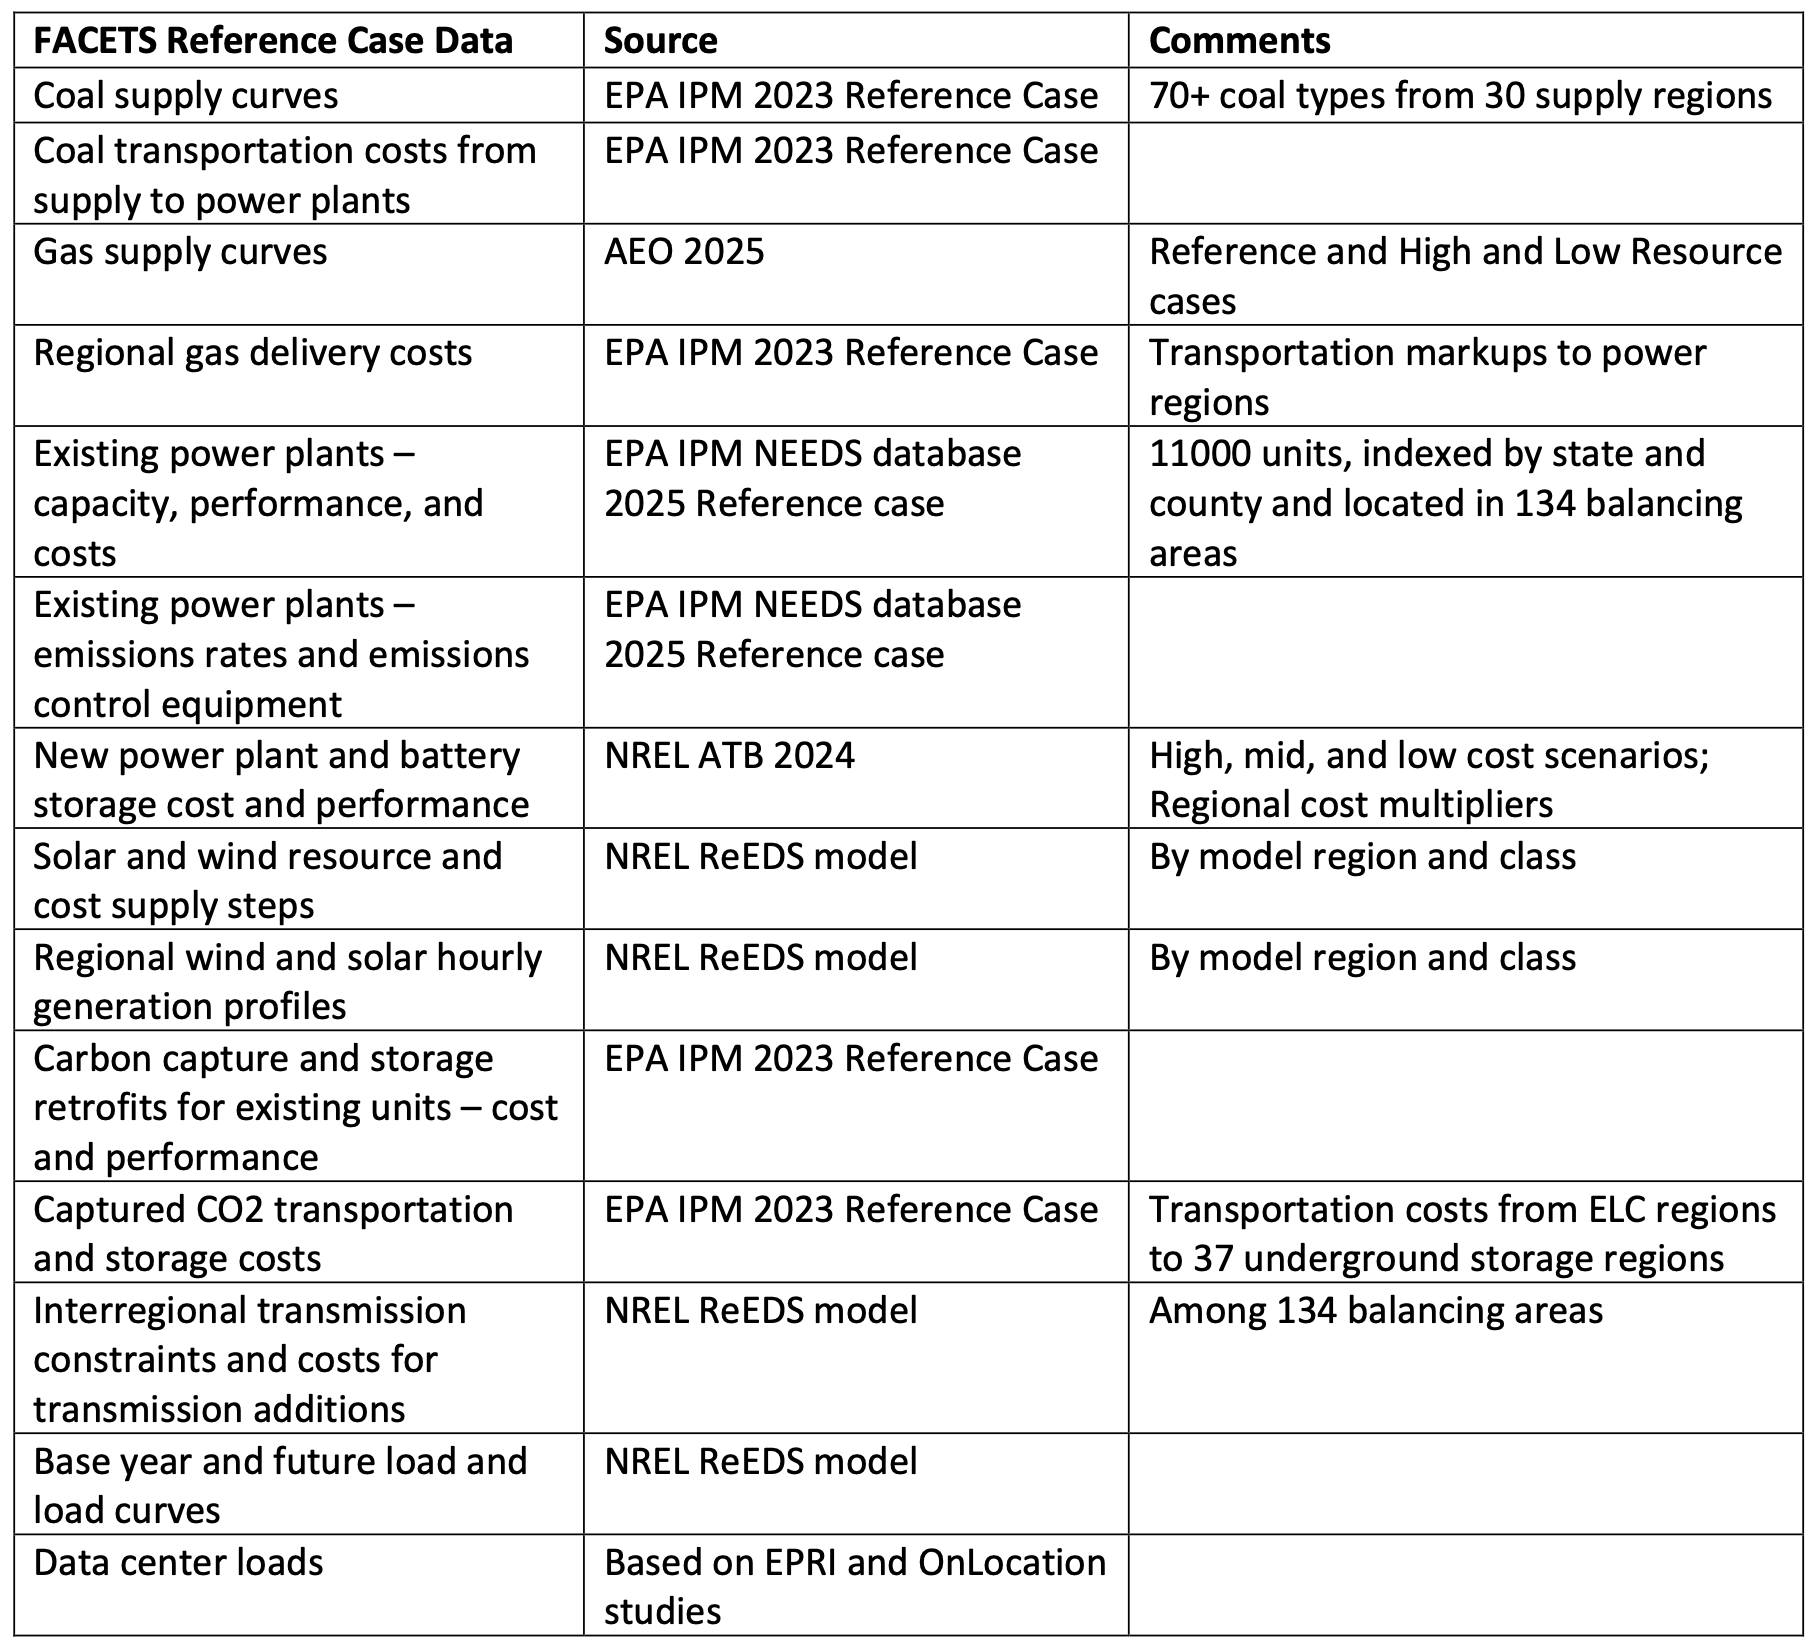
FACETS Data Sources – FALL 2026
Data has been drawn from high quality, publicly available sources, as detailed below. The dataset describing existing electricity generating units is drawn from the EPA National Electric Energy Data System database (NEEDS). Hydropower plants, existing wind and solar, and small gas and oil units have been aggregated by model region. All other plant types are represented at the unit level. The model may economically retire existing units whenever they are not part of the least cost solution relative to other options for meeting demands.

Each existing plant is tagged with its latitude and longitude, so that unit-level results can visualized. Existing units have been geo-located in the 134 balancing areas (BAs) of the National Renewable Energy Laboratory (NREL) ReEDS model that form the basic regional structure of FACETS. Both existing inter-regional transmission capacity and investment options for capacity expansion are specified, enabling analysis of the costs and benefits of connecting renewable resources with distant loads.
The model can build new plants from a suite of options whenever it finds it cost effective to do so. Cost and performance scenarios for new plant options are taken from the NREL Annual Technology Baseline 2024 scenarios. Supply curves for wind and PV installations are drawn from detailed ReEDS model data. Each supply step's production is characterized by an 8760 hourly generation profile, which is then aggregated into model time slices, selected to capture the relationship between peaks and valleys of both generation and load profiles.
Carbon capture and sequestration (CCS) retrofits are available for individual existing coal units with capacity 100 MW or greater. Costs for retrofits, along with the cost of CO2 transport from plant to storage basin, and storage supply curve are derived from EPA’s IPM 2023 Reference case.
Coal supply, quality, and transportation cost information have been drawn from EPA’s IPM 2023 Base Case. There are 70 different coal types, distinguished by grade, sulfur content, and 37 supply regions. Coal plants are assigned applicable coal grades (bituminous, subbituminous, and/or lignite) based upon NEEDS data. Unit-level SO2 permit rates and any SO2 removal equipment, also drawn from NEEDS, restrict the sulfur content of fuels available to each plant.
Stepped supply-cost curves for natural gas are built from quantities and elasticities derived from AEO scenarios. Alternate trajectories for shale and tight gas are calibrated to the AEO Reference, High Resource, and Low Resource cases. Regional gas delivery markups are drawn from EPA IPM.
EElectricity loads and load shapes are specified at the BA region level, based upon scenarios provided by NREL. State-level projections for data center loads were developed based on recent studies by EPRI and OnLocation, with input from state stakeholders. An alternate model formulation derives electricity demand endogenously from device choices in the end-use sectors.
Endogenous energy efficiency opportunities are specified as state-level supply curves for $/MWh saved. Potentials are derived from EPRI’s State Level Electric Energy Efficiency Potential Estimates study. EPRI provided economic potential without and with additional incentives. For FACETS, we broke the economic potential available with no further incentive into three equal cost steps, assigning costs derived from the LBNL 2015 Total Cost of Saved Energy study to the three steps. We then added two further steps consisting of the additional potential EPRI estimated to be economic at incentives of $10 and $20/MWh. The resulting potential as a fraction of total national load grows from 11.5% in 2025 to 18.3% in 2050.